
Science updates
Summaries of current running-related research
They broke the temperature into four range categories (quartiles):
- 41 - 50 degrees F (5-10 degrees C)
- 50.1 - 59 degrees F (10.1 - 15 degrees C)
- 59.1 - 68 degrees F (15.1 - 20 degrees C)
- 68.1 - 77 degrees F (20.1 - 25 degrees C)
Marathon results and weather data were collected for several major marathons including Boston, New York, Twin Cities, Richmond, Grandma's, Hartford and Vancouver over periods of 6-36 years. They compared the top three finishers performances with course records for the appropriate time frame, and also compared performances of "slower" marathoners (the 25th, 50th, 100th and 300th place finishers) with those course records. Both males and females were studied.
bottom line - wbgt does affect performance and it's not pretty! Two take aways:
- The higher the WBGT, the more effect it has on performance
- The slower the runner, the bigger the impact the WBGT has on performance.
The authors devised a prediction formula that may be used to estimate how much performance suffers based on temperature and race duration. Then they put the formula into a graphic format (a nomogram). Unfortunately they didn't evaluate any times slower than the 3:00 finishers, but the trend is pretty clear; environmental conditions affect slower runners to a greater degree than the faster ones, but even the elites at the front are not immune to the heat.Consider these findings:The top 3 runners experienced only about .9% slower performance for each 5 degree C increase in WBGT.The 25th place finishers saw a 1.1% hit to their performance for each 5 degree C.The 50th, 100th and 300th place finishers experienced an even greater impact of 1.5%, 1.8%, and 3.2% respectively for each 5 degrees C increase in WBGT.
To put that into perspective, the top runners (for example a 2:10 finisher) might see thier average pace per mile slow by only about 2.7 seconds per mile for each 5 degrees C increase in WBGT. This means their "ideal" of 2:10 in the lowest WBGT quartile slows to about a 2:14 finish in a WBGT of 77 degrees F (25C). On the other end of the spectrum, the 300th place runner (the 3:00 marathoner) could anticipate slowing by about 13.2 seconds a mile for each 5 degrees C increase in WBGT. That means their "ideal" 3:00 finish in the lowest WBGT quartile slows to a 3:23 in the highest WBGT quartile.
To put that into perspective, the top runners (for example a 2:10 finisher) might see thier average pace per mile slow by only about 2.7 seconds per mile for each 5 degrees C increase in WBGT. This means their "ideal" of 2:10 in the lowest WBGT quartile slows to about a 2:14 finish in a WBGT of 77 degrees F (25C). On the other end of the spectrum, the 300th place runner (the 3:00 marathoner) could anticipate slowing by about 13.2 seconds a mile for each 5 degrees C increase in WBGT. That means their "ideal" 3:00 finish in the lowest WBGT quartile slows to a 3:23 in the highest WBGT quartile.
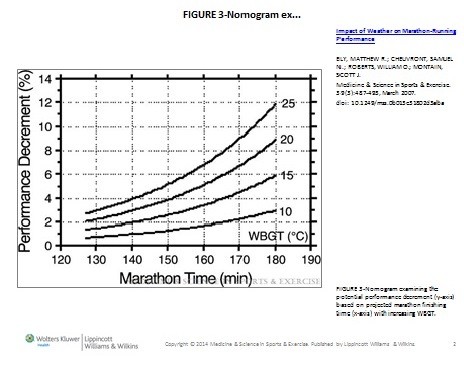
Using the nomogram the authors devised from their formulas, you can see that at a WBGT of 68 degrees F (20 C) a runner who is able to do a 2:30 marathon (150 minutes) in 40F might expect about a 4% slower time (about 6 minutes slower overall) in these warmer conditions. A 3-hour marathoner in that same environment could expect a 9% slower finish time (about 16 minutes) vs. the cooler (41F) marathon! To use the prediction nomogram below, simply find the line that represents the WBGT on race day, and then slide your finger down the line until you get to the vertical line that represents your athlete's cool weather (41F) finish time. Now read across to the left to determine what % performance decrement to expect based solely on the difference in WBGT.
Although they didn't project out to higher temperatures or slower athletes - if you just assume that the performance of the 4:00, 4:30 and 5:00 marathoners is at least as impacted as it was for the 3:00 marathoner, you can use the same multiplier to come up with a reasonable estimate of performance in various temperatures. For Example:
Although they didn't project out to higher temperatures or slower athletes - if you just assume that the performance of the 4:00, 4:30 and 5:00 marathoners is at least as impacted as it was for the 3:00 marathoner, you can use the same multiplier to come up with a reasonable estimate of performance in various temperatures. For Example:
- 4:00 marathon = 240 minutes. WBGT on race day is 68 degrees F (20 C). There's a 3.2% hit for each category level above 5C so multiply 3.2% by 3 (you're three catgories warmer) to get 9.6%. Then it's simple math: 240 minutes X 1.096 = 263 minutes
- 263 minutes equates to 4:23
As a coach - what do you do with this information? Use this information to consider how you schedule key races for your athletes, and how you adjust your pace guidance on race day. Pacing errors in a marathon are all-too common; if your athlete goes out too fast without respecting the hot and humid conditions, he or she risks a disappointing finish time and a pretty miserable running experience.
Let's say your athlete has previously turned in a 3:00 marathon in cool temperatures (40 degrees F). Today's race day dawns with a WBGT temperature of 60 degrees F (15 C). Based on this research, it's reasonable to anticipate they'll be about 6% slower than they would be at around 40F. If you do the math for your 3:00 marathoner, you'll find it changes the anticipated finish time to about a 3:10. Pace per mile should be adjusted from the "planned" 6:52 to a more realistic 7:17. Failure to take the environmental conditions into account will likely come with a penalty later in the race!
Although not a perfect substitute for WBGT, you can use heat index as a starting reference. The National Weather Service heat index calculator can be found HERE and further explanation of WBGT can be found HERE
Medicine & Science in Sports & Exercise: March 2007 - Volume 39 - Issue 3 - pp 487-493.